Fig 1. A simple scatter plot of one data column
against another.
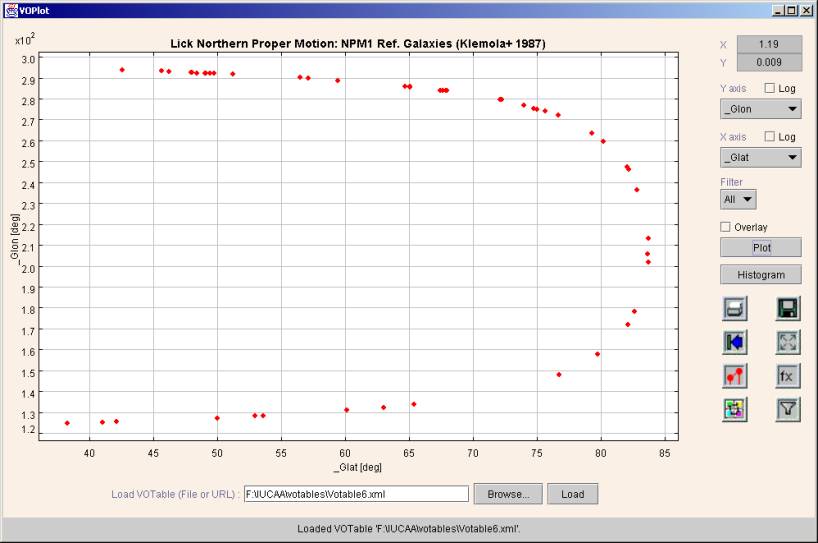
Fig. 2. A simple histogram of a data column.

Fig. 3. Two overlaid plots distinguished by
different marker types.

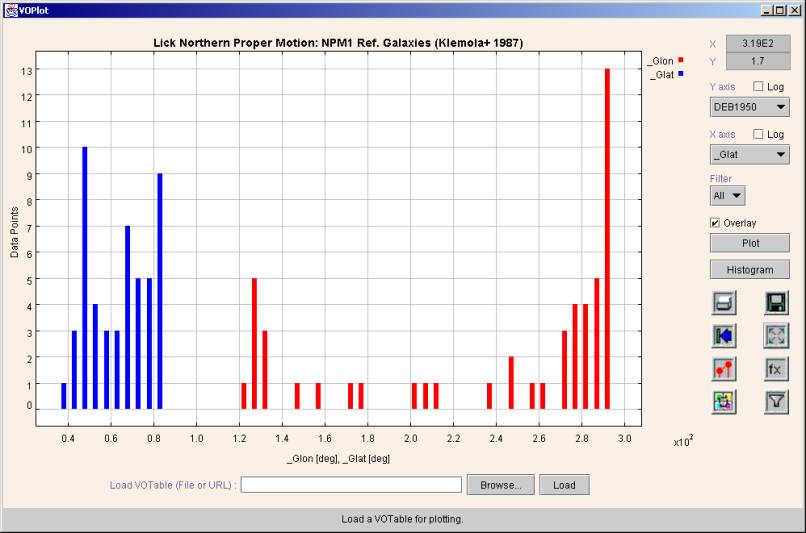
Fig. 4 Overlaid histograms of two data columns,
distinguished by different colors.